Augmented Analytics: Part 1

As a data analytics enthusiast, I like to stay updated on the top trends in data analytics and where the future of analytics is heading. One of the most exciting and recent developments in this field is augmented analytics. This revolutionary approach leverages artificial intelligence (AI) and machine learning (ML) to automate and enhance the entire analytics process. From data preparation to insight generation and interpretation, augmented analytics can automate it all, enabling users of all skill levels to extract meaningful insights from data without needing deep technical expertise.
In Part 1 of this article, let's explore which platforms have embedded augmented analytics and how some companies are making the most of it. This will also enable you to think at an organizational level to leverage platforms and technologies that can help you adopt and automate analytics in your company.
In Part 2, we will find out if augmented analytics is a threat to analysts like you and me. We will also explore some of the best practices that you and your team can adopt to leverage augmented analytics effectively. Finally, we will close with some pitfalls and challenges to look out for when using augmented analytics.
Now without further adiue, let's dive in!
How Are Companies Adopting Augmented Analytics and What Tools to Use?
💡Automated Data Preparation and Integration
The most time-effective use case for augmented analytics is automatic data preparation. Personally, I have faced numerous challenges in cleaning messy data, especially with something as complex as entity resolution, where different data sources refer to the same entity but name it differently. However, Augmented analytics makes the data preparation process less manual and more robust. This allows analysts like you and me to focus on generating insights rather than getting bogged down in the complexities of data preparation.
For instance, I've used Palantir Foundry's ready-made tool for entity resolution. Behind the scenes, it used advanced machine learning algorithms like clustering and gradient boosting to find and merge duplicate records across different datasets, making entity resolution more accurate. The process was surprisingly straightforward for me—I just had to grant access to the data sources needing resolution, train the model by approving or rejecting certain combinations (around 150 rows) through a user-friendly interface, and that was it. The tool efficiently handled entity resolution for the remaining million rows of data without further intervention.
Likewise, machine learning algorithms have the capability to enable easy outlier detection, imputation of missing values and a lot more. By automating these tedious tasks, augmented analytics empowers organizations to efficiently manage their data and make more informed decisions. Some of the tools that offer automated data preparation are:
- Alteryx (my favourite)
- Astera
- Altair Monarch
- Talend
- Datameer
You can read more about them and their features here. They are all low-code, no code platforms helping to streamline and automate the entire data preparation process. Most of them allow you to connect to various data sources, including databases, files, and APIs, to access raw data easily.
An example of a company that has leveraged Augmented Analytics is Amazon. Amazon used automated data preparation to deliver exceptional personalization experiences for its customers, thereby cementing its leadership position in the highly competitive market. By using ML algorithms, Amazon automated the process of data cleansing and merging from multiple touchpoints, such as browsing history and purchase data. This ensured that the data was precise and up-to-date and provided personalized, real-time product recommendations that significantly increased customer satisfaction and customer conversion rates.
💡Automated Data Visualization
Augmented analytics can make data visualization more accessible to business users saving the time that goes in the iteration of requirement gathering and dashboard modification over time. Users can ask questions directly in natural language and receive visual responses. For example, typing "show sales trends for the last quarter" could generate a line chart depicting the sales trends over that period. It can further give different chart suggestions to the user which might be more appropriate. It can also prompt users to ask certain questions which can provide more insights into the data.
Modern Business Intelligence tools are fast adopting augmented analytics to remain on top in the competitive landscape. For instance, Qlik offers AI-powered 'Insight Advisor' to allow users to create visualizations based on natural language searches; recommend associations between data tables; customize charts based on preferences; and take into account the intent and behaviours to generate insights that are context-aware and relevant.
Learn more about this exciting feature in this video:
Source: Qlik, https://www.youtube.com/watch?v=PO7GwxfdfFQ
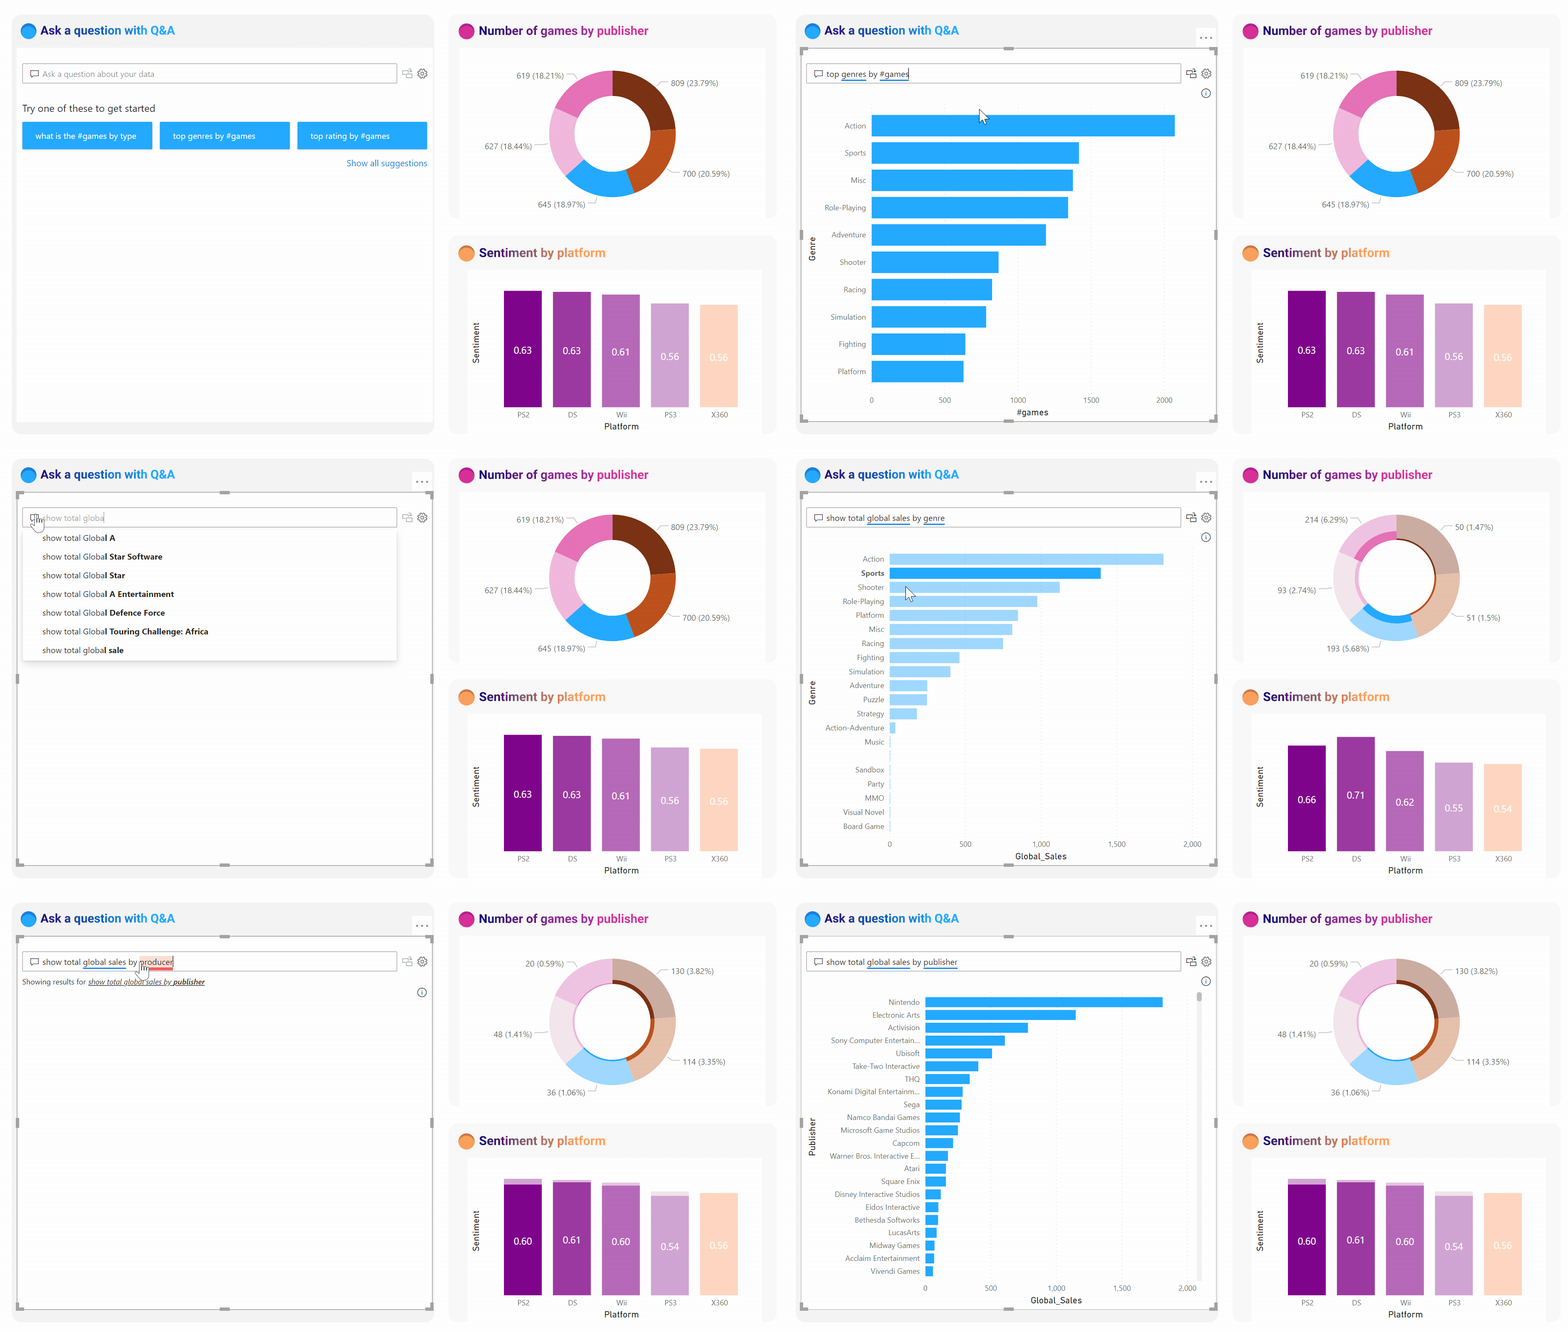
Similarly, Power BI has incorporated Augmented Analytics in their dashboards through 'Q&A Visual'. It allows business users to quickly get answers from their report data and allows designers to use the Q&A features to quickly create visuals.
(I got so much appreciation in my previous company when I used this Q&A feature when no one knew about it and gave it a Google search look and feel through some custom images. Keeping up to date surely helps! :D)

Additionally, Microsoft launched Copilot feature in Power BI. An AI assistant to work alongside report developers and to support business users. Using Copilot, analysts can easily write DAX queries, create a report page, summarize the dashboard and save their precious time on documentation, enhance Q&A feature by adding synonyms, understand the data model and the list goes on.
Tableau has also introduced the Copilot feature to support analysts in a similar way. Along with that, it has launched Tableau Pulse which caters to business users by delivering daily key information similar to newspaper headlines. It would essentially enable users to dive deeper by asking follow-up questions for more detailed insights, facilitating quick and informed decision-making. Tableau is also set to launch Tableau Gestures. If you don't know about this, you got to see it! Check out the demo by Andy Cotgreave. I saw it live in the London Tableau Conference and could not believe my eyes!
There are other BI tools like Domo and ThoughtSpot that are also becoming market leaders in Augmented BI. All in all, companies are fast enabling Augmented Analytics for data visualization and yet it is still seen as the future of BI. In the present day, we still get requests to build BI reports the traditional way and have limited access to these smart AI features as some of them are still under development and some of them are yet to be launched and some are quite expensive.
Other BI tools such as Domo and ThoughtSpot are also emerging as market leaders in Augmented BI. All in all, companies are swiftly adopting Augmented Analytics for enhanced data visualization, recognizing it as the future of BI.
However, in the current landscape, I feel there is still a huge demand for traditional BI report-building methods. I can say this with confidence since I work in a Business Intelligence Team that has its presence globally. Access to advanced AI features still remains quite limited, as some are in development or awaiting launch, while others can be prohibitively expensive. I believe, as we navigate this transition, balancing traditional approaches with emerging AI capabilities is crucial for maximizing insights and operational efficiency.
💡Enhanced Predictive Analytics
Augmented analytics can elevate predictive analytics by automating complex processes, enhancing model accuracy, and making advanced analytics accessible to a broader audience. It can automate the process of training and optimizing predictive models. This includes selecting the best algorithms, tuning hyperparameters, and validating model performance. This automation ensures that the models are both accurate and efficient, while freeing data scientists to focus on more strategic tasks.
Moreover, with automated model retraining, augmented analytics can ensure that predictive models are always up-to-date with the latest data trends. This continuous learning process helps maintain high levels of accuracy over time, even as the underlying data evolves. This can also help to detect and correct biases in the data and models, ensuring that predictions are fair and unbiased.
Again, there are several platforms available to help adopt predictive analytics with AI. For example, Altair AI Studio features 'Auto Model' for model generation and deployment support and model monitoring. It also includes a generative AI extension for building and accessing large language models. There are a few others such as H2O Driverless AI, IBM Watson Studio, SAP Predictive Analytics, SAS Visual Data Science etc that have similar capabilities. You can read more about these here.
An example of a company that leveraged augmented predictive analytics is Verizon, Verizon is a major telecommunications company, that used advanced augmented analytics to improve its network performance and predictive analytics. By applying powerful machine learning algorithms, it could predict potential network problems and automate the management of network data. This proactive approach allowed them to address issues before they affect service quality. As a result, Verizon saw a remarkable reduction in network downtime, significant cost savings, and higher customer satisfaction. Their use of AI-driven insights showcased the importance of real-time decision-making in the telecommunications industry.
Overall, through augmented predictive analytics, organizations can derive more precise and actionable insights, ultimately driving better decision-making and strategic planning.
Well, there is so much that Augmented Analytics can do. This might sound a bit threatening to analysts whose day-to-day work is increasingly being automated by these advanced tools.

SHOULD YOU AND I BE WORRIED? Let's find out in the part 2.
References:


