First Glance at Data

Have you ever found yourself face-to-face with a sea of data and wondered,
"Well, umm what next?" 😮
Does the urge to dive into the analysis immediately strike, or perhaps assumptions start forming like shadows in the dark? If you find yourself nodding, you're in for a treat. This guide is here to steer you clear of these common pitfalls and make your journey through data not just accurate but downright fascinating. ✨
Data analysis is like searching for buried treasure. Before you can find the gold, you need to carefully map the terrain and understand the clues.
Thoughtful investigation paves the way for meaningful analysis. So let's take this step by step, and understand what roadmap you could follow before jumping onto the data analysis.
- Identify the scope of the data:
Start by thinking about the questions you want to answer through your data and carefully examine if your dataset aligns with the aim of the analysis.
Let's understand this with an example, consider you're investigating air quality in your city and aiming to understand patterns of pollution. You decide to focus on variables such as pollutant levels (like PM2.5), the time of day, and specific locations where measurements were taken. So, your essential data set includes Date, Time, Pollution Levels, and Location.
However, keep in mind that this dataset might not answer certain questions, like the sources of pollutants (industrial, vehicular, etc.), the impact on specific demographics, or the long-term trends in air quality. You might also realize that your available data spans a limited timeframe, say the past two years, preventing you from making statements about historical changes in air quality.
While your chosen variables are tailored to answer specific questions about daily pollution patterns, it's crucial to acknowledge the limitations early on. You wouldn't want to delve into your analysis only to discover later that you need information on the sources of pollutants or the socio-economic factors influencing air quality, potentially derailing your initial focus. Understanding the scope of your data ensures a more targeted and effective analysis.
- Find out the source of the data:
I find a lot of people missing this step but it is quite essential to know about where the data is coming from. If you have not collected the data yourself, you should ASK where the data has been taken from. Is the source even reliable? Continuing on the above example, you would want to know if the information gathered is from reputable environmental monitoring stations, official records, or community-sourced platforms. This would also help you identify any biases or limitations early on. A dataset gathered solely from monitoring stations may not fully capture pollution levels in residential areas.
It will also prevent you from making bad conclusions. For instance, if the data is specific to certain locations or timeframes, you wouldn't want to make broad, inaccurate conclusions about air quality trends that may not be representative of the entire city.
In essence, investigating the source of your data not only allows for a more robust analysis but also generates more trust in your conclusions.
- Have an Elastic Mind
Often even before starting the analysis, we tend to have some natural cognitive biases in our thinking. Perhaps, these biases originate from the prior knowledge we have about the subject. But, these biases or preconceived notions create blind spots in our thinking often causing us to dismiss the patterns that contradict those beliefs. In the words of Nate Silver, "While it is tempting to see data through the lens of our expectations, true insight arises when we approach it with an open mind, letting the evidence speak for itself."
Approaching data with a clear mind allows for unbiased exploration, ensuring that findings are driven by the evidence rather than pre-existing beliefs. It opens the door to alternative perspectives and innovative ways of interpreting the data, leading to more comprehensive and creative insights.
- Check the quality of your data
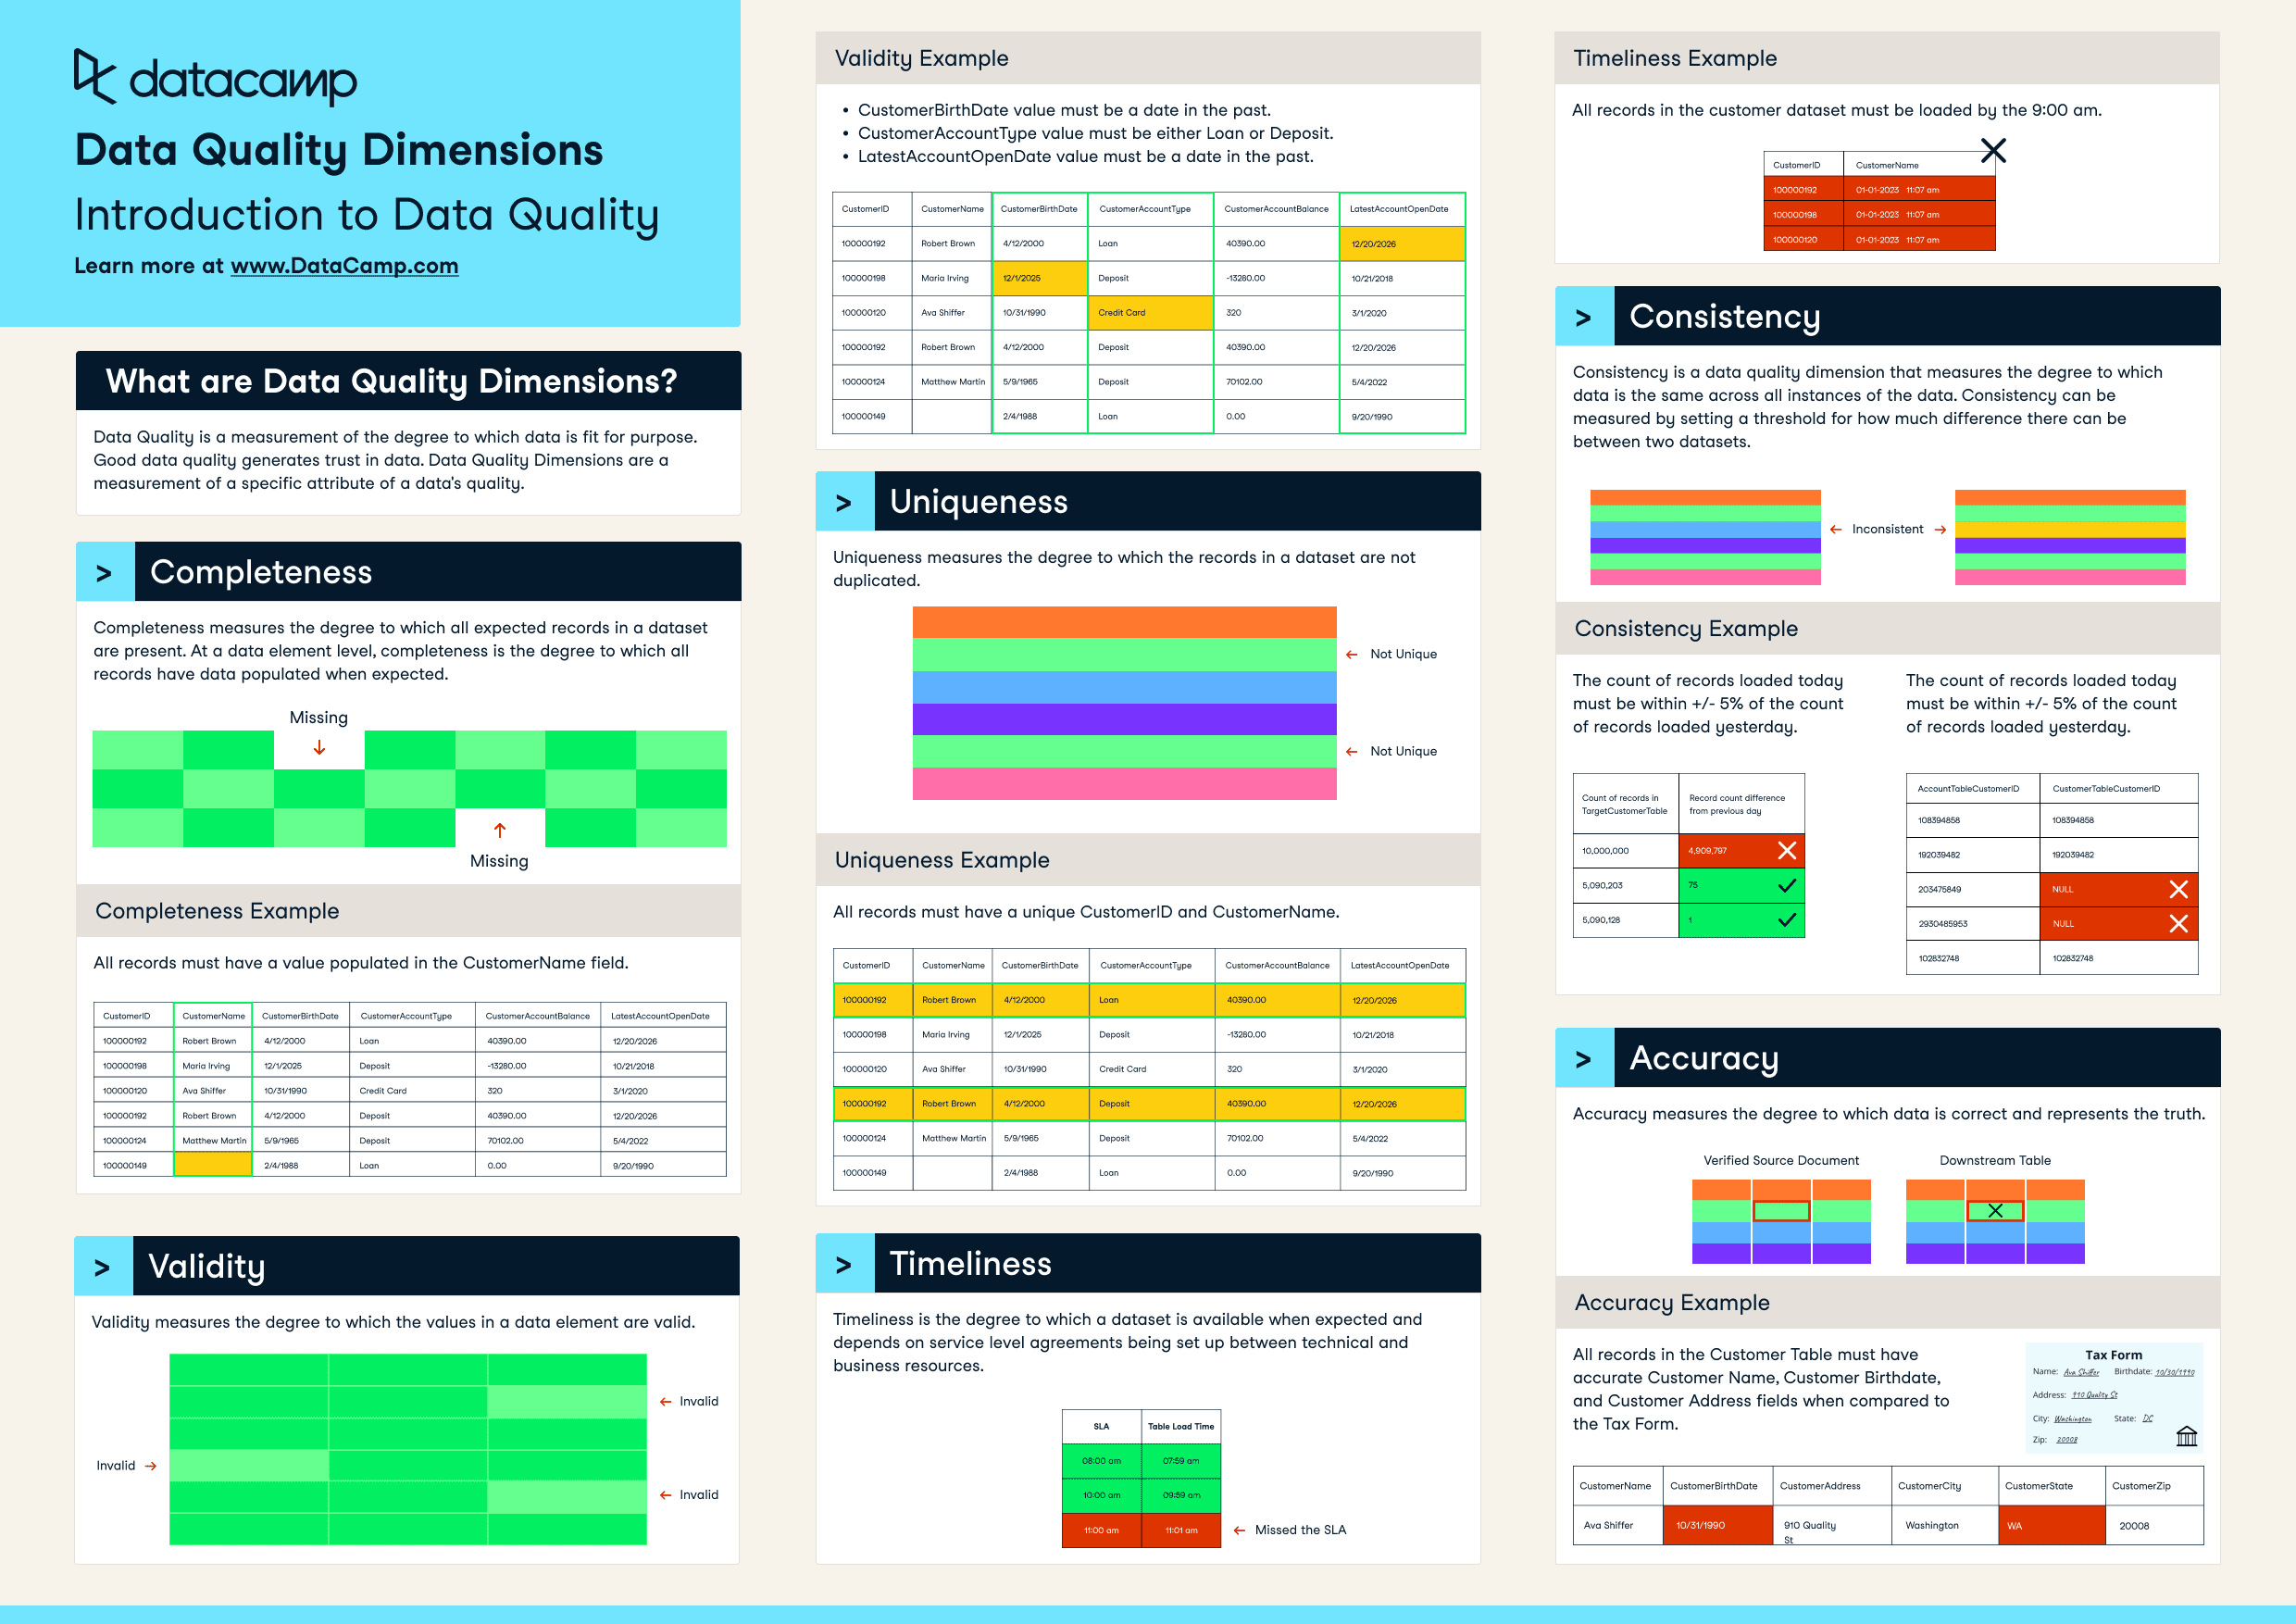
In the world of computing, there is an age old saying "Garbage in, Garbage Out". It is the most succint way to emphasise on how crucial it is to check the quality of your data before you start analysing it. So what is it exactly that you need to check in your data? Typically, there are 6 data quality dimensions that you can stick to. This is an amazing cheat sheet by Data Camp which explains all the 6 dimensions with easy to understand examples: https://www.datacamp.com/cheat-sheet/data-quality-dimensions-cheat-sheet

You can use ETL tools like Alteryx or coding languages like R, Python etc to check the quality of your data. Even data visualization tools like Power BI enable you to check the quality of data. Basically, you can use any tool (even excel) to do some basic but super important quality checks of your data.
Conclusion:
Data Analysis is the result of informed curiosity. Investigate the data with a curious mind, and the analysis will be a journey of discovery rather than a destination. Concluding this blog in a hope that these 4 steps can help in making your data journey a little less frowning, and a little more enjoyable.😊

